Natural Hazards and Risk: Where Earth processes and society intersect
Did you know Japan is home to over 100 active volcanoes and experiences thousands of earthquakes annually? Despite this, Japan is ranked 28th regarding risk from natural hazards by the 2022 World Risk Report. The United States is ranked 18th, while countries like Mexico and Myanmar populate the top ten. So why is Japan so far down the list? It’s due to a host of other factors. Let’s find out!
Introduction
Think about the place where you live. What comes to mind? You might think about the physical space, the people you live with, how much you pay to live there, or what is close by. Now think about the place you live differently: what would happen if there were an earthquake nearby, or a flood, or a wildfire? Do you know how often things like earthquakes, floods, and wildfires occur where you live? Would you know what to do if something like that happened?
Earthquakes, floods, and wildfires are all examples of natural hazards: phenomena in the Earth system with the potential to impact individuals, communities, and society as a whole. Natural hazards include:
- Weather-related phenomena, like severe storms and tornadoes
- Geological phenomena, like earthquakes and volcanic activity
- Hydrological phenomena, like floods and drought
Learning more about the frequency and potential severity of natural hazards in a particular region can help reduce catastrophic impacts on humans, because knowing what can happen allows individuals, communities, and societies to prepare. When we are prepared for hazards, we are more resilient and better able to recover from any impacts they have.
Now, think again about where you live. The chance that you will experience any particular natural hazard is based on the region’s climate and tectonic setting (the proximity to faults and volcanoes), as well as more localized geology and topography. However, the risk that natural hazards pose to you and your community is based on more than these physical factors. Calculating the risk you face involves understanding the hazard, your exposure to it, and any vulnerabilities that might worsen the impacts of the hazard and make it difficult for you and your community to adapt or recover.
The relationship between hazard and risk
Every year on September 1, schools and local governments across Japan conduct emergency drills. Students practice dropping to the floor, getting under cover, and holding on when earthquake shaking begins (see Figure 1). They also learn how to use a fire extinguisher to put out fires that can start in the aftermath of an earthquake. Government agencies conduct elaborate drills to practice responding to an event, including setting up emergency headquarters and planning responses to major damage in cities like their capital, Tokyo. Why September 1? September 1 is Disaster Prevention Day, established by the Japanese government in 1960 to commemorate the date of the Great Kanto Earthquake, a magnitude 7.9 or greater earthquake that occurred in 1923 and devastated the cities of Tokyo and Yokohama. September 1 is also when children return to school after a summer break, providing an opportunity to reach all school-aged children, and is during peak typhoon season, which brings powerful storms and flooding to the islands. All of these reasons make September 1 a good date to commemorate.
Figure 1: Elementary students during an earthquake drill in Japan.
image © CC BY 3.0 telegraph.co.ukJapan’s annual preparedness reminder to individuals, organizations, and governments is more than a commemoration, however. In addition, it is an important safety strategy for the country. Japan is located on a subduction zone where the Pacific plate is descending beneath the island nation. As a result, the country hosts 111 active volcanoes and experiences thousands of earthquakes a year, a handful of which are large enough to cause damage.
These local earthquakes and volcanic eruptions can generate tsunamis that inundate Japan’s coast. Because of its location on the western margin of the Pacific Ocean, Japan also receives tsunamis generated by earthquakes from as far away as South America. It is also prone to typhoons (the name for hurricanes that form in the northwest Pacific Ocean) that gather strength as they travel across the ocean. The mountainous terrain, combined with the potential for heavy rain and snowfall, means that landslides and avalanches are also common occurrences.
In other words, Japan’s population of 125 million people is exposed to a wide range of potentially devastating natural hazards. And yet, in the 2022 World Risk Report, Japan ranks relatively low in the world in terms of risk from natural hazards: 28th. The Philippines tops the list, with countries as diverse as Mexico, Myanmar, and Madagascar in the top ten (the United States is ranked 18th). Why is this the case? What makes the people of the Philippines so much more vulnerable to the impacts of an earthquake or volcanic eruption than Japan, which experiences more of both?
To answer this question, we need to define several terms—hazard, exposure, vulnerability, risk, and disaster—and how they are quantified and related to each other.
Punto de Comprensión
Hazard
A hazard is a natural process or phenomenon that can produce damaging impacts on a community and society. Natural hazards include ground shaking and tsunami from earthquakes, ashfall and lava flows from volcanic eruptions, inundation from river and coastal flooding, heavy rains and high winds in hurricanes, and more.
Scientists collect data on the frequency, magnitude, and characteristics of natural hazards in a particular area to make predictions about the likelihood of their occurrence in the future. Those data are often presented on maps for use by other scientists and the general public. For example, in Japan, hazard maps for about 75 of the 111 active volcanoes show where lava is likely to flow and how thick the ashfall would be from a large eruption. The maps are based on scientists’ knowledge of previous eruptions and the prevailing wind direction. A hazard map for Mt. Fuji is shown in Figure 2.
Figure 2: Volcanic hazards map and information brochure for Mt. Fuji, Japan.
image ©Used under the Government of Japan Standard Terms of Use (Ver.2.0).In the United States, the U.S. Geological Survey (USGS) produces seismic hazard maps that show the likelihood of severe ground shaking based on the distribution and magnitude of past earthquakes and the underlying geology. Similarly, the Federal Emergency Management Agency (FEMA) produces flood hazard maps based on topography (the elevation of the land) and the probability of high streamflow (the volume of water carried by a stream). The more we learn about the characteristics, frequency, and magnitude of all these events through careful observations, the more we can make accurate maps and predictions to help communities prepare.
Exposure
Hazard maps show the likelihood of a particular hazard occurring in an area. But we also need to know what else is in those areas—in other words, what is exposed to the hazard. Exposure is determined by quantifying the value of the people, property, infrastructure, and ecosystems that could experience damaging impacts from a particular hazard.
For example, many of Japan’s volcanoes that lack hazard maps are on remote islands with no inhabitants; therefore, there is no exposure. In contrast, Japan’s exposure to large earthquakes is very high: Tokyo is a densely populated world business capital filled with skyscrapers, bullet trains, schools, hospitals, and home to nearly 14 million people (see photo in Figure 3). The city is very likely to experience damaging impacts from earthquakes that occur on a long portion of the subduction zone. The buildings and people are exposed not only to the shaking, but also to the potential tsunami that an earthquake could generate.
Figure 3: Apartment buildings in Tokyo on the harbor.
image ©CC0 1.0We often describe exposure in numbers: the estimated cost to repair or rebuild collapsed buildings and bridges; the number of people living in a given area. As the world’s population has grown and countries have become more developed over time, our collective exposure to hazards has increased because there are more of us building more things. Communities can reduce their exposure to particular hazards by using hazard maps and other data to decide where to allow residential and commercial building.
Punto de Comprensión
Vulnerability
Many communities are exposed to natural hazards around the world. Yet those communities may experience different short- and long-term effects, even from the same hazard. That is because not every group is equally vulnerable to the damaging impacts of a hazard. Vulnerability describes the potential for harm and disruption to a community from a particular hazard.
Physical, economic, political, and social factors influence a community’s vulnerability, to potential for harm. Physical factors, like construction quality and building codes, determine the extent to which buildings (and the people inside them) are damaged or destroyed. Economic and political factors, like the influence of a community on policies, their financial ability to implement them, and access to technology like smartphones, determine whether evacuation routes for major storms are identified, maintained, and made visible. And social factors, like the connections within a community and language diversity, can determine the extent to which individuals learn about the potential risk and how to prepare in the event of an emergency. All these factors influence the short-term impact of a hazard on a community and how much time it takes to recover in the long-term.
Reducing vulnerability to particular hazards may require legislation, such as passing and enforcing building codes for earthquake safety—Japan is the world leader in this particular area—and this varies from country to country (and state to state within countries) depending on the will of the people. In addition, reducing vulnerability often requires the recognition of systemic inequities that make some groups more vulnerable due to their socioeconomic status, race and ethnicity, or immigration status, among other things. In the United States, the Environmental Protection Agency (EPA) has combined census data with hazard maps and other datasets in their Environmental Justice Mapper to allow communities to identify vulnerable populations and areas.
Risk
The risk that a community or country faces is determined by combining the characteristics of the hazard, the exposure to that hazard, and the community’s vulnerability. If there is no hazard (no active volcanoes, for example, or no possibility for coastal flooding for an inland community), there is no risk. But if a hazard is present, the risk varies based on the hazard’s characteristics and the community’s assets and preparedness.
For example, a country like Japan experiences frequent, large earthquakes that produce severe ground-shaking, especially in parts of Tokyo where the ground consists of unconsolidated sediments that amplify shaking (that’s the hazard). Tokyo’s large population and many buildings are exposed to that hazard. However, Japan has a very long history of earthquakes and has done several things to reduce its vulnerability. The country enacted strict building codes and innovative engineering solutions that prevent even tall skyscrapers from collapsing in strong shaking. Schools and public events integrate drills and education about what to do in the event of an earthquake. Japan is a wealthy, developed country with a common language and strong community networks. It has had the economic means to implement all these actions that reduce its vulnerability and, thus, its overall risk.
You can explore the relationship between hazards, exposure, vulnerability, and risk for a few cities in the United States in the animation below.
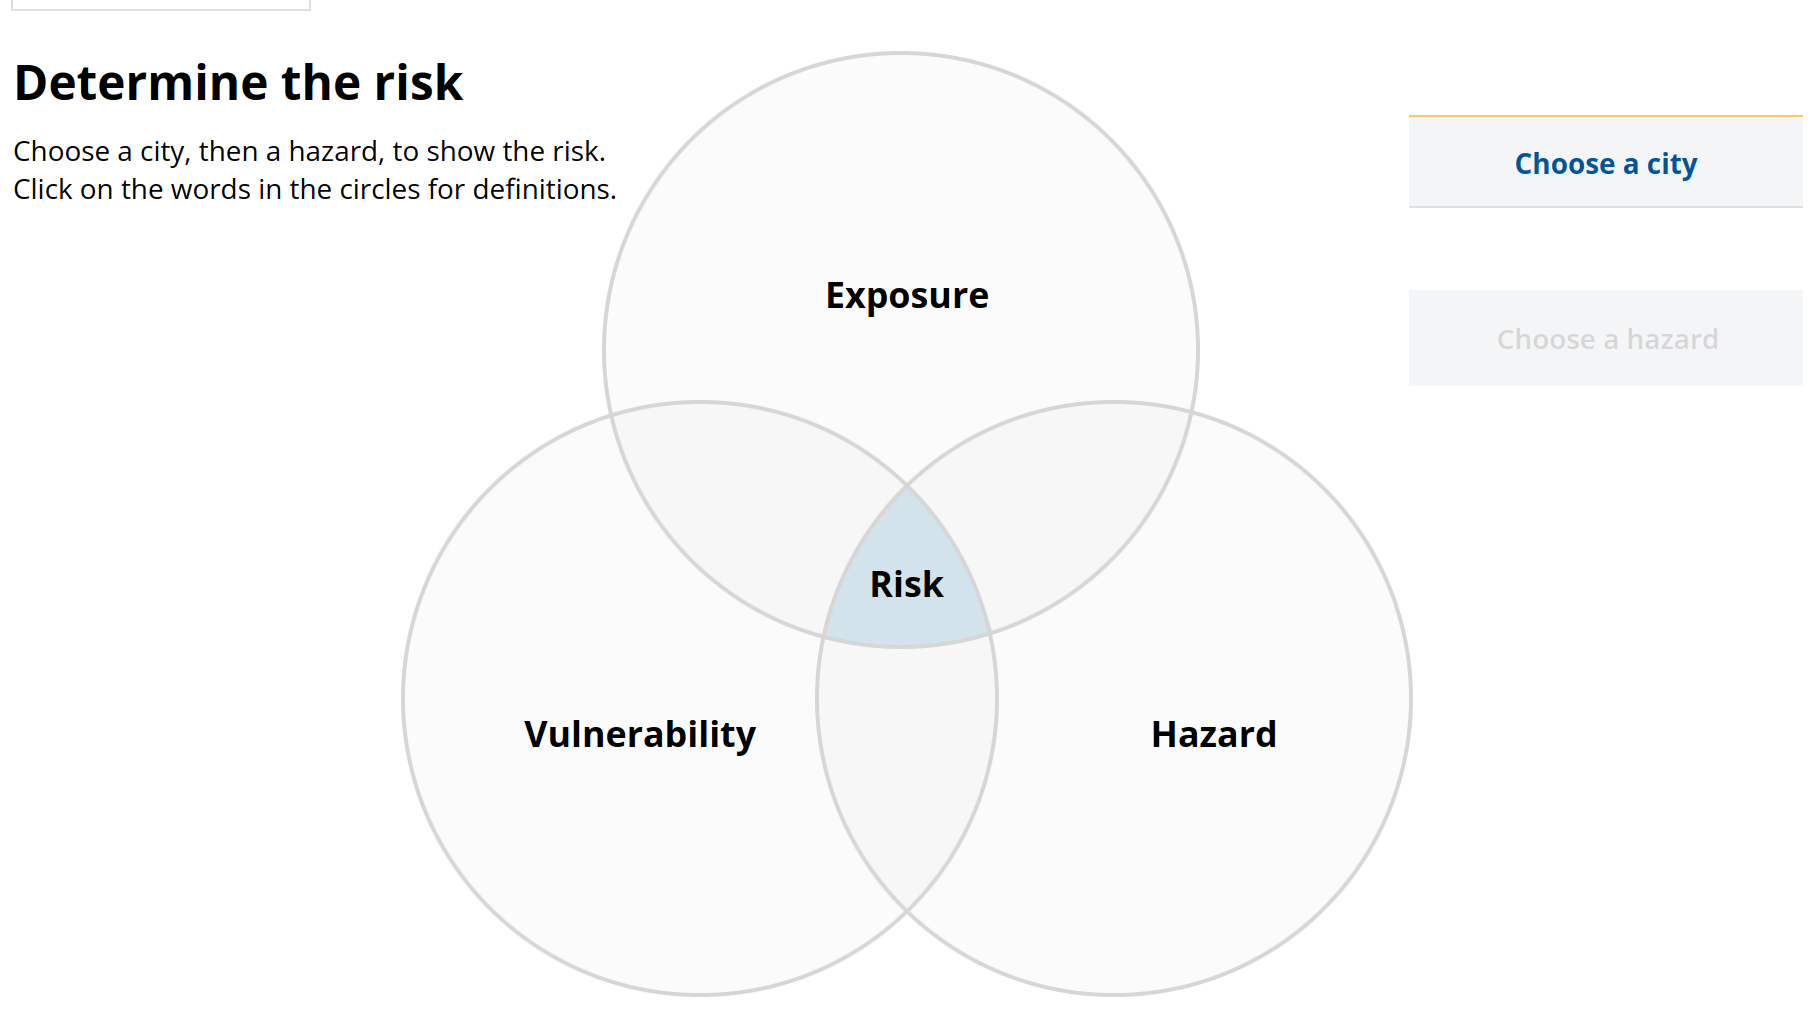
Animación Interactiva: Hazards & Risks
How do we define disaster?
September 1 in Japan is not Risk Reduction Day, however: it is Disaster Prevention Day. What does this word, disaster, mean? Many people use the word disaster in everyday conversation for a situation where many things go wrong. That same sense of the word is true for its use when referring to natural hazards: whereas “risk” is the potential for damage, “disaster” is the actual damage and harm resulting from an event. A disaster overwhelms the ability of a localized group to respond. For example, a city may need to call on its state; the state may need to call on the federal government. A country may need to call for international aid. The goal of reducing exposure and vulnerability to natural hazards is to prevent otherwise minor to moderate hazardous events from becoming disasters.
Punto de Comprensión
The role of scientists
Natural hazards have impacted individuals, communities, and society as a whole as long as humans have existed. Every person who has recorded careful observations of an event like a volcanic eruption, earthquake, tsunami, or typhoon has contributed to our understanding of these phenomena and their potential to impact us. These careful observations have been recorded in many ways throughout time, from Samoan place names and tattoos that commemorate volcanic activity (Fepuleai et al., 2017) to detailed written records of tsunamis and earthquakes in Japan starting in 416 CE (Ishibashi, 2004).
Today, scientists use two main approaches to better understand and predict hazards:
- Monitoring of currently active systems
- Studying past events preserved in the historical and geologic records
They apply what they learn through these approaches to a world where the population is increasing and the climate is warming to understand and reduce risk.
Monitoring active systems
In the United States and other countries, monitoring is part of the mission of many science agencies and is critical to predicting hazardous events. For example, stream gauges monitor water flow along the length of river systems and can help make predictions about flow changes downstream, including potential floods. Agencies around the world monitor gas emissions from active volcanoes, along with changes in the height and shape of the volcano and small earthquakes, all of which correlate with the movement of magma in the subsurface that can lead to an eruption (see Figure 4). Seismographs installed around the world, connected through the Global Seismograph Network, record earthquakes of all sizes to determine how the constant motion of the Earth’s tectonic plates is accommodated through earthquakes. Satellites have a continuous view of the atmosphere to monitor the development of large storm systems and how smoke from wildfires travels.
Figure 4: Combined seismic and GPS monitoring station on the north flank of Mt. Hood, a volcano in the Cascade Mountains in Oregon.
image © Image courtesy USGS, in the public domain.Data collected through these monitoring efforts is most useful when it is networked and made widely available to allow patterns to be detected. Most monitoring occurs through government agencies. In the United States, the USGS monitors many potential hazards through widely distributed instruments that collect data continuously. These data are freely available to the general public as well as to scientists around the world.
Studying past events
Our modern records of natural hazards often do not extend far enough back in time for us to reliably use them in making predictions. Very large events—whether they are very large earthquakes, volcanic eruptions, or superstorms—happen rarely, with entire generations in between them. As a result, we cannot rely on our monitoring systems, which have been in place for a hundred years or less, to provide us with the information we need. In addition, scientists study observations recorded by others in journals, newspapers, oral histories, and other written records and document in detail the impacts of large events when they happen. They also look back in time through geological investigations to identify, map, and date prehistoric volcanic eruptions, earthquakes, floods, tsunamis, and other events.
This is the work of thousands of scientists around the world today at government agencies, private companies, and universities, and it is critically important to the development of accurate predictions about the frequency and magnitude of events in a particular system. Paleoseismologists dig trenches across faults to identify the age and magnitude of past earthquakes. Volcanologists map the flanks of volcanoes to document the extent and age of past lava flows and ash deposits. Sedimentologists dig pits in coastal environments to identify and date tsunami deposits and try to tie them to a specific earthquake. Geomorphologists identify landslide deposits and use their size and shape to determine the cause. Atmospheric scientists look at rainfall distribution and winds to better constrain storm size and impact.
Adapting to a changing world
One of the reasons that this work is ongoing is because all the factors involved in determining risk—the characteristics of the hazards, the exposure, and our vulnerability—can and do change. Climate change is one factor that is requiring many communities to reassess their hazards. For example, rising sea level means that the frequency and magnitude of hazards like coastal flooding are changing; a generally warming climate means that temperature and precipitation changes can increase the frequency of landslides and consequent flooding. Vulnerability is changing, too, as coastal communities have greater potential to be isolated from help even during non-hazard events. Scientists need to combine data about major storms, tides, and models of projected sea level rise to develop hazard maps. The maps can be combined with the most recent census data and other information to assess the risk and how it might change as the global climate continues to warm.
Punto de Comprensión
Reducing the risks of hazards
Describing the hazard is a critical step. However, description alone cannot prepare communities and reduce their risk. Mitigating the impact of a natural hazard—reducing risks and preventing a disaster—requires combining the work of scientists with the social, economic, and political realities of communities.
For example, in New Zealand, scientists long ago identified the Alpine fault as the source of a potentially disastrous earthquake. The Alpine fault has not had an earthquake in historic times, but scientists have identified several large earthquakes through geological excavations and other techniques and agree that it will likely host a very large earthquake again in our lifetimes. The Alpine Fault Magnitude 8 group is a coalition of scientists, policymakers, regional councils (community leaders), emergency managers, and others that collaborate to identify vulnerable communities and provide education to prepare individuals, communities, and local governments for a large earthquake (Orchiston et al., 2018).
By definition, natural hazards exist at the intersection of science and society. Scientists work to develop our collective understanding of the characteristics, frequency, and magnitude of particular hazards. That work can help inform policies and practices that mitigate the impact of hazards on individuals and communities.
Think back again to where you live. What kind of natural hazards might you encounter? Are you ready for them? If you live outside Japan, consider establishing your own “Disaster Prevention Day” to find out how you can reduce your risk to natural hazards in your area.
Table of Contents
Activate glossary term highlighting to easily identify key terms within the module. Once highlighted, you can click on these terms to view their definitions.
Activate NGSS annotations to easily identify NGSS standards within the module. Once highlighted, you can click on them to view these standards.